(Washington, DC) – The District’s reported data for January 6, 2022 includes 1,928 new confirmed positive coronavirus (COVID-19) cases, bringing the District’s overall confirmed positive case total to 110,040.
Beginning today, DC Health will also report ‘Probable Cases’ data, which includes self-reported positive rapid antigen test results submitted through the over-the-counter test reporting portal.
From October 15, 2021 through January 7, 2022, 59,438 rapid antigen test results were reported, which includes 6,728 self-reported probable positive cases. This includes data from DCPS Safe Return results.
COVID-19 cases are defined per the Centers for Disease Control and Prevention (CDC) and DC Health as confirmed, probable, or suspect based on laboratory, clinical, and exposure data. Reporting of home-based or point-of-care rapid antigen test results may not be complete or representative of case rates in the community. Probable cases can be used in conjunction with confirmed cases to track disease spread, but will be reported separately from confirmed cases to be consistent with CDC definitions.
The community is encouraged to continue reporting the results of their rapid tests at coronavirus.dc.gov/overthecounter
The District reported that two additional residents lost their lives due to COVID-19.
- 59-year-old female
- 85-year-old male
Tragically, 1,227 District residents have lost their lives due to COVID-19.
Visit coronavirus.dc.gov/data for interactive data dashboards or to download COVID-19 data.
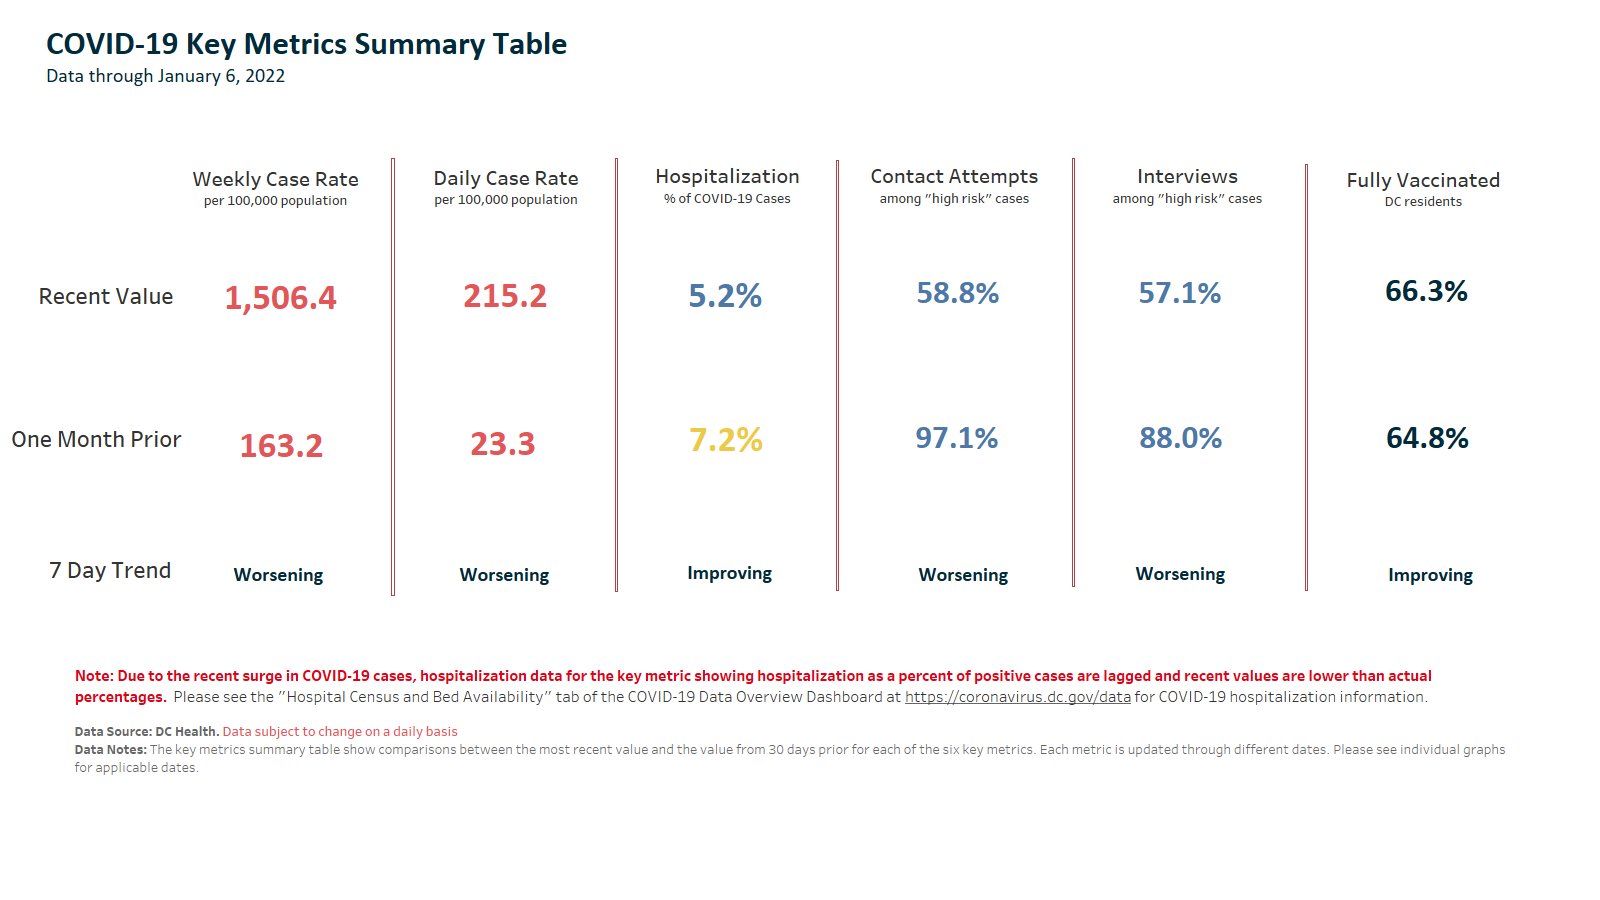
Below is the District’s current Key Metrics Summary Table.
Below is the District’s aggregated total of positive COVID-19 cases, sorted by age and gender.
|
|
|
Patient Gender |
||||||
|
Total Confirmed Positive Cases |
% |
Female |
% |
Male |
% |
Unknown |
% |
|
|
All |
110,040* |
100 |
58,458 |
100 |
50,434 |
100 |
1,148 |
100 |
|
Unknown |
224 |
<1 |
84 |
<1 |
111 |
<1 |
29 |
3 |
|
0-18 |
20,703 |
19 |
10,335 |
18 |
10,091 |
20 |
277 |
24 |
|
19-30 |
30,923 |
28 |
17,651 |
30 |
12,968 |
26 |
304 |
26 |
|
31-40 |
22,684 |
21 |
11,953 |
21 |
10,473 |
21 |
258 |
22 |
|
41-50 |
13,180 |
12 |
6,786 |
12 |
6,243 |
12 |
151 |
13 |
|
51-60 |
10,426 |
9 |
5,192 |
9 |
5,160 |
10 |
74 |
6 |
|
61-70 |
6,799 |
6 |
3,487 |
6 |
3,286 |
6 |
26 |
2 |
|
71-80 |
3,228 |
3 |
1,778 |
3 |
1,432 |
3 |
18 |
2 |
|
81+ |
1,873 |
2 |
1,192 |
2 |
670 |
1 |
11 |
1 |
*Includes <5 cases in age group 19-30 and 51-60 who reported gender as Other/Transgender.
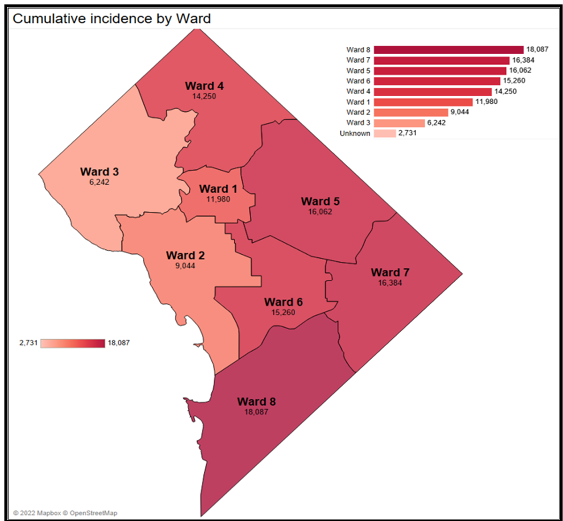
Below is the District’s aggregated total of positive COVID-19 cases, sorted by ward of residence.
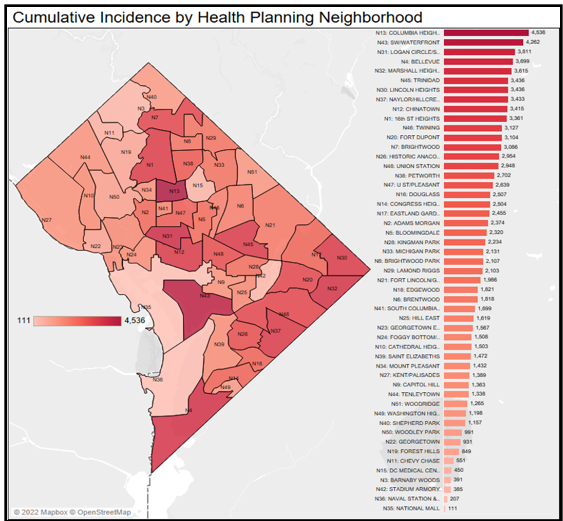
Below is the District’s aggregated total of positive COVID-19 cases, sorted by neighborhood of residence.
Below is the District’s aggregated total of positive COVID-19 cases, sorted by race.
|
|
Total Confirmed Positive Cases |
Percent |
|
All |
110,040 |
100 |
|
Race |
|
|
|
Unknown |
1,392 |
1 |
|
American Indian/Alaska Native |
148 |
<1 |
|
Asian |
2,163 |
2 |
|
Black/African American |
55,673 |
51 |
|
Native Hawaiian/Pacific Islander |
199 |
<1 |
|
Other/Multi-Racial |
26,313 |
24 |
|
White |
24,150 |
22 |
|
Refused During Interview |
2 |
<1 |
|
Ethnicity |
|
|
|
Unknown |
17,825 |
16 |
|
Hispanic or Latinx |
13,814 |
13 |
|
NOT Hispanic or Latinx |
78,381 |
71 |
|
Refused During Interview |
20 |
<1 |
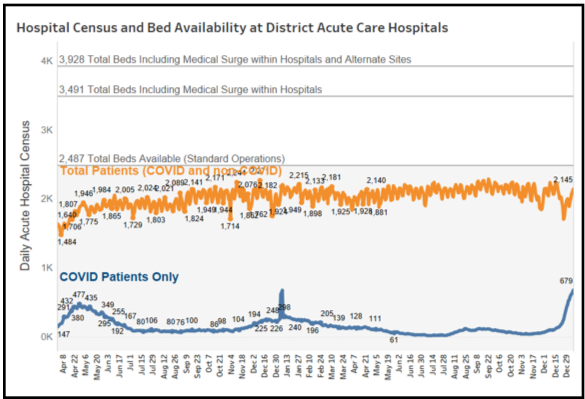
Below is the District’s Hospital Census and hospital bed availability at District hospitals.
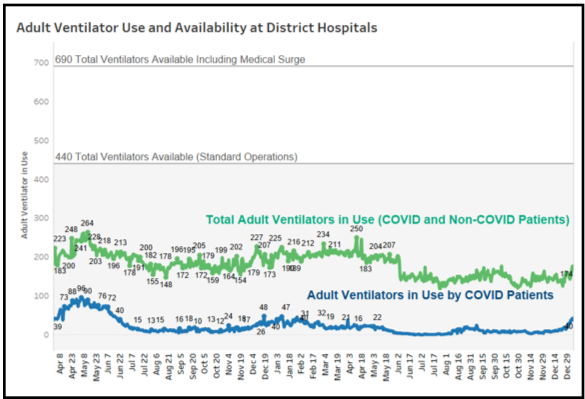
Below is the ventilator use and availability at District hospitals.
The District currently has 47 intensive care unit (ICU) beds available in hospitals out of 345 total ICU beds.
- 298 total ICU inpatients
- 85 COVID-19 positive ICU inpatients
Below is the District’s total lives lost due to COVID-19, sorted by race.
|
Race |
Total Lives Lost |
Percent |
|
All |
1,227 |
100 |
|
Asian |
14 |
1 |
|
Black/African American |
950 |
76 |
|
Hispanic/Latinx |
126 |
11 |
|
Non-Hispanic White |
112 |
10 |
|
Other |
25 |
2 |
Below is the District’s total lives lost due to COVID-19, sorted by sex.
|
Sex |
Total Lives Lost |
Percent |
|
All |
1,227 |
100 |
|
Female |
566 |
45 |
|
Male |
661 |
55 |
Below is the District’s total lives lost due to COVID-19, sorted by age.
|
Age |
Total Lives Lost |
Percent |
|
All |
1,227 |
100 |
|
<19 |
0 |
0 |
|
20-29 |
5 |
0 |
|
30-39 |
26 |
2 |
|
40-49 |
53 |
4 |
|
50-59 |
162 |
13 |
|
60-69 |
301 |
24 |
|
70-79 |
293 |
24 |
|
80+ |
387 |
32 |
Below is the District’s total lives lost due to COVID-19, sorted by ward of residence.
|
Ward |
Total Lives Lost |
Percent |
|
All |
1,227 |
100 |
|
1 |
113 |
10 |
|
2 |
52 |
5 |
|
3 |
58 |
5 |
|
4 |
180 |
15 |
|
5 |
225 |
18 |
|
6 |
130 |
11 |
|
7 |
194 |
16 |
|
8 |
247 |
19 |
|
Experienced Homelessness |
24 |
2 |
|
Unknown |
4 |
0 |
Guidance has been published for healthcare providers, employers and the public to provide information on what to do if you have been diagnosed with or are a contact of someone who has COVID-19.
Residents are encouraged to get vaccinated at one of our free walk-up vaccination sites located throughout the District. For more information, please visit vaccines.gov.


