(Washington, DC) - The District’s reported data for December 30, 2021 – January 2, 2022 includes 9,201 new positive coronavirus (COVID-19) cases, bringing the District’s overall positive case total to 103,487.
The District reported that seven additional residents lost their lives due to COVID-19.
- 77-year-old male
- 75-year-old female
- 55-year-old female
- 75-year-old female
- 84-year-old male
- 59-year-old female
- 60-year-old female
Tragically, 1,218 District residents have lost their lives due to COVID-19.
Visit coronavirus.dc.gov/data for interactive data dashboards or to download COVID-19 data.
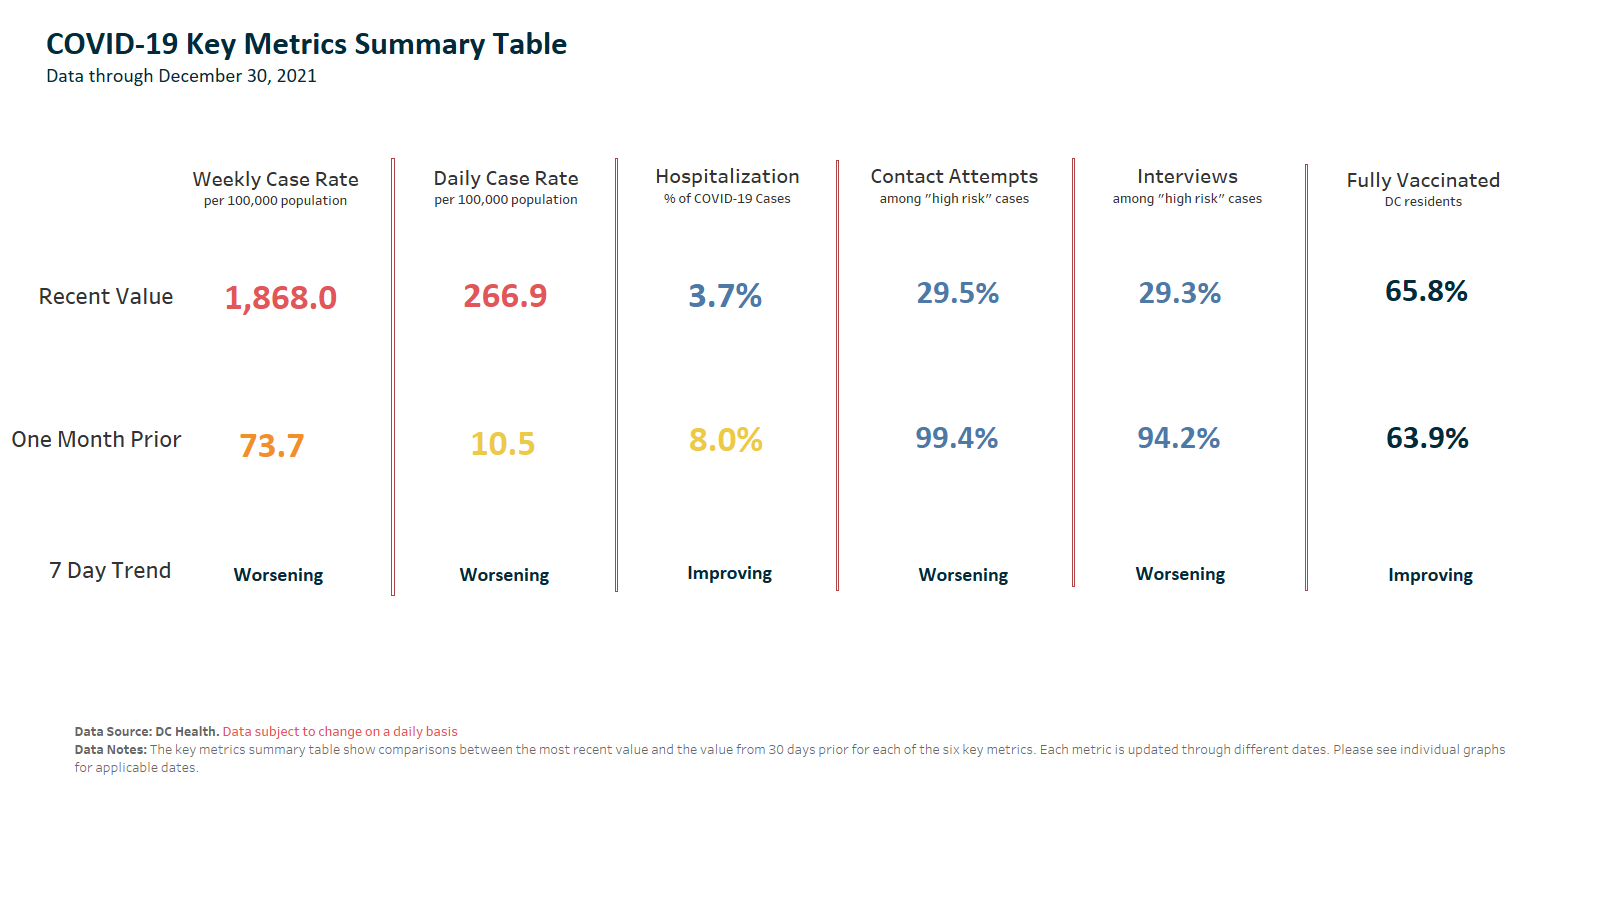
Below is the District’s current Key Metrics Summary Table.

Below is the District’s aggregated total of positive COVID-19 cases, sorted by age and gender.
|
|
|
Patient Gender |
||||||
|
Total Positive Cases |
% |
Female |
% |
Male |
% |
Unknown |
% |
|
|
All |
103,487* |
100 |
55,006 |
100 |
47,580 |
100 |
901 |
100 |
|
Unknown |
199 |
<1 |
80 |
<1 |
107 |
<1 |
12 |
2 |
|
0-18 |
19,538 |
19 |
9,790 |
18 |
9,542 |
20 |
206 |
23 |
|
19-30 |
29,283 |
28 |
16,721 |
30 |
12,300 |
26 |
262 |
30 |
|
31-40 |
21,339 |
21 |
11,228 |
20 |
9,909 |
21 |
202 |
22 |
|
41-50 |
12,302 |
12 |
6,309 |
11 |
5,876 |
12 |
117 |
13 |
|
51-60 |
9,731 |
9 |
4,855 |
9 |
4,819 |
10 |
57 |
6 |
|
61-70 |
6,323 |
6 |
3,236 |
6 |
3,067 |
7 |
20 |
2 |
|
71-80 |
3,018 |
3 |
1,667 |
3 |
1,336 |
3 |
15 |
2 |
|
81+ |
1,754 |
2 |
1,120 |
2 |
624 |
1 |
10 |
1 |
*Includes <5 cases in age group 19-30 and 51-60 who reported gender as Other/Transgender.
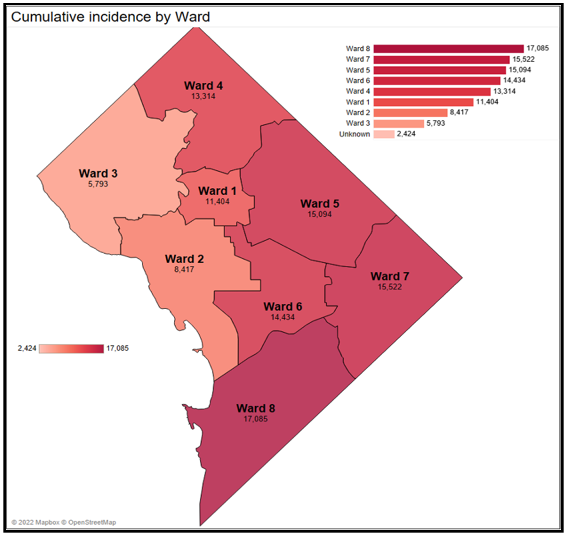
Below is the District’s aggregated total of positive COVID-19 cases, sorted by ward of residence.

Below is the District’s aggregated total of positive COVID-19 cases, sorted by neighborhood of residence.

Below is the District’s aggregated total of positive COVID-19 cases, sorted by race.
|
|
Total Positive Cases |
Percent |
|
All |
103,487 |
100 |
|
Race |
|
|
|
Unknown |
4,928 |
5 |
|
American Indian/Alaska Native |
141 |
<1 |
|
Asian |
2,000 |
2 |
|
Black/African American |
51,083 |
50 |
|
Native Hawaiian/Pacific Islander |
184 |
<1 |
|
Other/Multi-Racial |
22,556 |
22 |
|
White |
22,593 |
22 |
|
Refused During Interview |
2 |
<1 |
|
Ethnicity |
|
|
|
Unknown |
18,254 |
18 |
|
Hispanic or Latinx |
12,839 |
13 |
|
NOT Hispanic or Latinx |
72,372 |
70 |
|
Refused During Interview |
22 |
<1 |
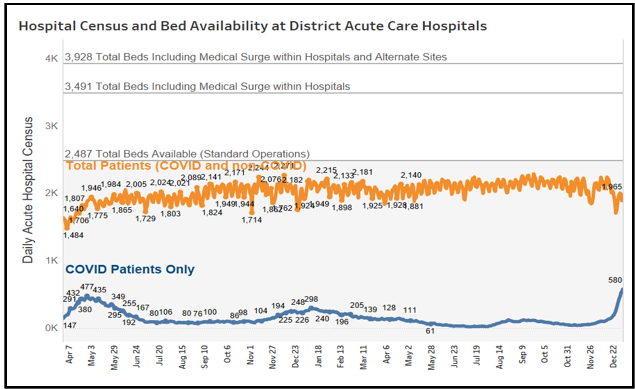
Below is the District’s Hospital Census and hospital bed availability at District hospitals.

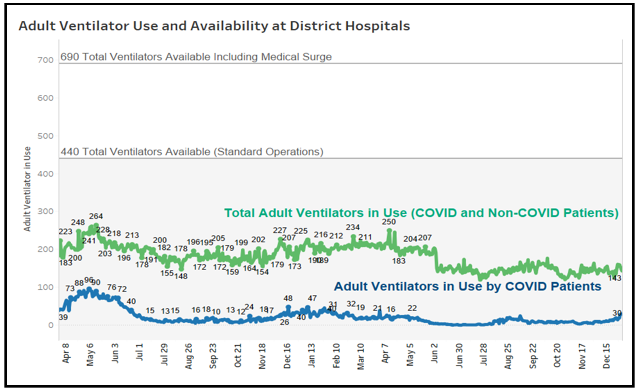
Below is the ventilator use and availability at District hospitals.

The District currently has 57 intensive care unit (ICU) beds available in hospitals out of 345 total ICU beds.
- 288 total ICU inpatients
- 74 COVID-19 positive ICU inpatients
Below is the District’s total lives lost due to COVID-19, sorted by race.
|
Race |
Total Lives Lost |
Percent |
|
All |
1,218 |
100 |
|
Asian |
14 |
1 |
|
Black/African American |
941 |
76 |
|
Hispanic/Latinx |
126 |
11 |
|
Non-Hispanic White |
112 |
10 |
|
Other |
25 |
2 |
Below is the District’s total lives lost due to COVID-19, sorted by sex.
|
Sex |
Total Lives Lost |
Percent |
|
All |
1,218 |
100 |
|
Female |
561 |
45 |
|
Male |
657 |
55 |
Below is the District’s total lives lost due to COVID-19, sorted by age.
|
Age |
Total Lives Lost |
Percent |
|
All |
1,218 |
100 |
|
<19 |
0 |
0 |
|
20-29 |
5 |
0 |
|
30-39 |
26 |
2 |
|
40-49 |
53 |
4 |
|
50-59 |
161 |
13 |
|
60-69 |
299 |
24 |
|
70-79 |
290 |
24 |
|
80+ |
384 |
32 |
Below is the District’s total lives lost due to COVID-19, sorted by ward of residence.
|
Ward |
Total Lives Lost |
Percent |
|
All |
1,218 |
100 |
|
1 |
113 |
10 |
|
2 |
52 |
5 |
|
3 |
58 |
5 |
|
4 |
178 |
15 |
|
5 |
224 |
18 |
|
6 |
130 |
11 |
|
7 |
191 |
16 |
|
8 |
244 |
19 |
|
Experienced Homelessness |
24 |
2 |
|
Unknown |
4 |
0 |
Guidance has been published for healthcare providers, employers and the public to provide information on what to do if you have been diagnosed with or are a contact of someone who has COVID-19.
Residents are encouraged to get vaccinated at one of our free walk-up vaccination sites located throughout the District. For more information, please visit vaccines.gov.


